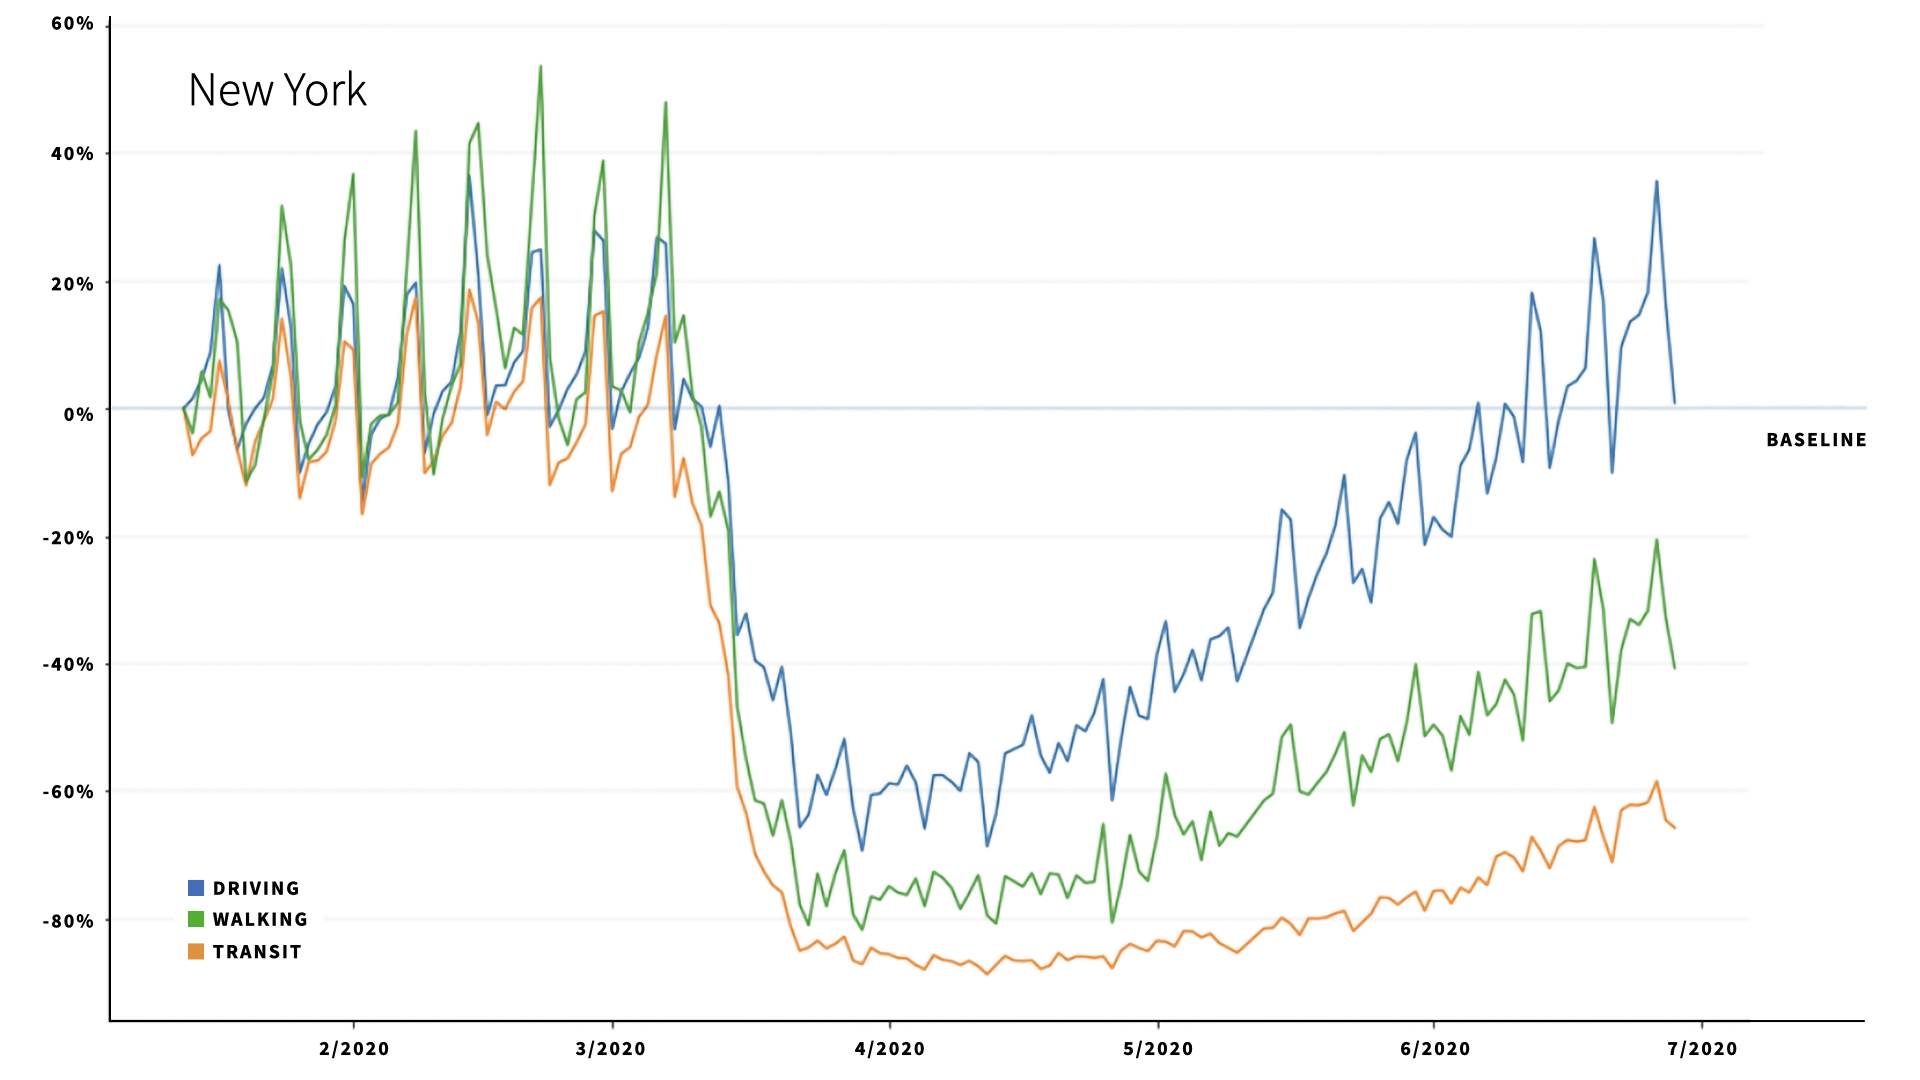
Cities are on the rebound with driving & walking on the mend.
After shelter-in-place began in mid-March, the month of April saw nationwide traffic bottoming out early on with incremental increases throughout May in both vehicular and pedestrian travel. Specifically, NYC vehicular traffic continues to rise above baseline while pedestrian slightly recovers going into July.
Source: Billups Sciences, SafeGraph
Increased Visitation
Similarly, top essential and non-essential businesses began to experience rising visitations through July 1, 2020 despite decreases below baseline.