Creating Control Groups for OOH Measurement
Introduction
Date
Author
billups
Type
Articles

The ability to measure Out-of-Home (OOH) advertising campaigns accurately has been an ongoing trend over the last several years as more and more data and analysis is available for other marketing channels. But how can brands and agencies ensure that their OOH partners are implementing a statistically rigorous model to obtain data on an increase in visitation to a physical location due to OOH advertising?
Although validatable measurement in outdoor advertising is possible, creating reliable control groups is a challenge in two key areas: spatial correlation and observability. Without proper controls in place it would be possible to skew data entirely, showing a much higher lift in visit to a Point of Interest (POI) than what actually occurred.
When using sampled mobile data for measurement, it is especially important to control the propensity for a device to be exposed. In most advertising studies it would be reasonable to assume that a large sample of the market broken into two groups should each have roughly the same proportion of the target audience. However, in OOH the picture is a bit murkier.
In this article, we outline several key considerations for scientifically rigorous out-of-home measurement, and share a few options for addressing them.
Data Quantity and Quality Influence Outcome Visibility
First, there are two interesting challenges that surface when attempting to measure the lift created by running OOH campaigns when the variable of interest is a change in the number of visitors to a physical location.
Spatial Correlation
The chief challenge in creating valid control groups for Out-of-Home media is spatial correlation. Spatial correlation in this case refers to how the devices are related to the OOH units and how the OOH units are related to the POI. This can play out in a number of interrelated ways.
First, a device’s probability of exposure is not independent of its home and work locations. Looking at where an owner of a device works and lives is predictive of exposure and needs to be accounted for in any control matching scheme.
Next, visitation to a place in the physical world can become spatially entangled with exposure to the OOH unit. The probability of a person visiting a POI increases the closer that the person gets to the POI. For example, if an advertisement is on top of the store’s location, then it is impossible to visit the store without being exposed to the OOH unit. This doesn’t show that OOH is driving traffic to the location, but is instead a reflection of someone already being on their way to that place.
It is essential to choose control and treated or campaign units that have similar rates of POI visitation prior to the campaign. If it is not controlled for then it can easily confound your results. For instance, if you place the advertisement on both sides of the road leading inbound to a store, it is not possible for a visitor to arrive at the store without first having had the opportunity to view the advertisement. In this case, visitation causes the advertisement to be seen (treatment), thus violating the assumptions of many causal modeling frameworks that the outcome can not cause the treatment.
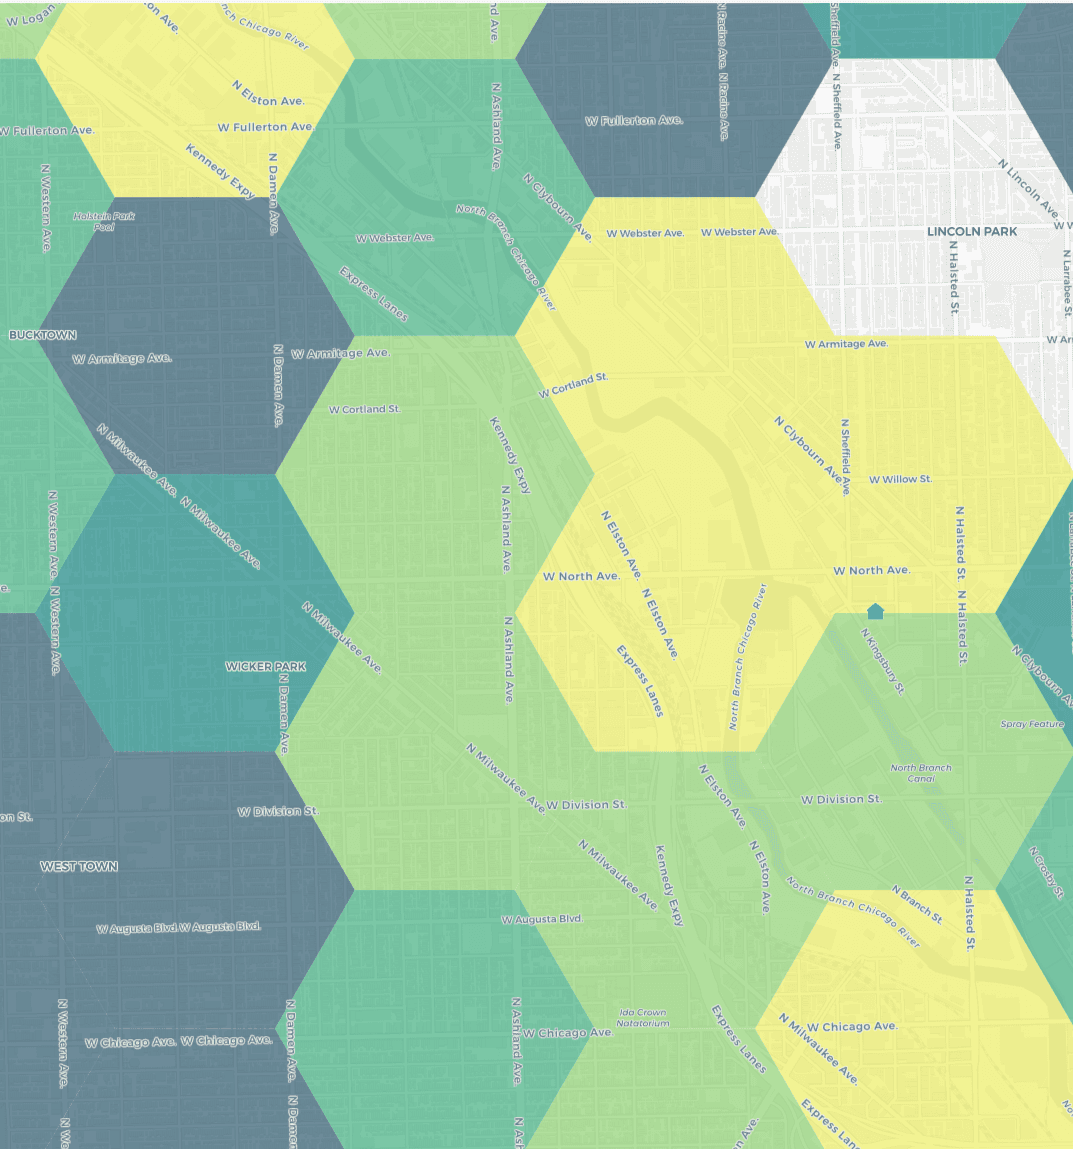
This map shows the average visitation rate to the POI (blue dot) for all OOH within each hexagon. The scale goes from lowest in dark blue to highest in light yellow. As one would expect the visitation rate decreases as the distance from the POI increases.
Observability
Another key challenge in working with mobile data and out-of-home measurement is the activity level of the device. We define activity level as the observability of the device’s movements along with the number of places outside of the home it visits per week. It follows that devices that are more active are more likely to be observed being exposed to the OOH, and they are more likely to be observed visiting the place of interest without intervention.
Some devices may ping their location quite frequently, whereas other devices may ping their location less frequently. It is important to match control devices to treated group devices that provide location data at similar rates. It is also important to choose devices that provide location data frequently, as infrequent pings could result in missing important information about a device’s exposure to an OOH unit or visitation to a POI.
If observability is not accounted for, then selection bias can lead to over-reporting of the campaign effect. Devices with more activity are more likely to be observed as exposed and visited, whereas low-activity devices are more likely to be observed as not-exposed and not-visited. At Billups, we endeavor to showcase a method that produces control groups that are good estimators of the expected outcome without exposure.
How Billups Implements Controls
For static units, we have a unique approach to try to control the spatial correlation. We measure visitation rates for two control (placebo) campaigns directly before the real campaign goes live. The first set of units we measure are those that will be used for the campaign. Since these units do not yet have advertising related to the POI, they can provide us with a good gauge of the average visitation rate for those who pass by the units. The second group of units has a similar audience composition to the campaign units and has a similar visitation rate pre-campaign to the desired location.
Since neither exposure has any brand messaging related to the campaign they should have no effect on a visit to the brand’s location. By setting similar visitation rates for the control groups we can later measure the effectiveness of the advertising on the campaign units and arrive at a less biased estimate of the base visitation rate.
We use the following rules to determine eligibility for a control device and unit:
The user of the device must match the demographics of the treated group
The device must not be exposed to the campaign at any point during the campaign
The device must be exposed to a certain number of other OOH advertisements during the campaign. This number should be comparable to the average number of OOH units that the control group was exposed to during the campaign pre-period.
The device must be observed to visit a number of locations outside their home location. This number can be empirically determined, but at Billups we find that greater than 3 provides reliable results.
If using control unit matching then the control OOH needs to match the campaign OOH in terms of spatial correlation and base visitation rates. It should also occupy a similar place on the visitation path as the treated OOH. Units that would be last to be seen before a visit should not be matched against units that are the first visits seen on a chain or path.
For digital and rotating devices we adapt the rules slightly to stipulate that the device was exposed to one of the other available spots on the campaign units, ideally as close in time as possible.
Billups’ Experimental Procedure
We created a causal graph that looks like this.
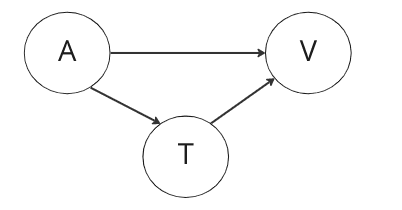
“A” represents the audience, “V” represents visitation and “T” (treatment) represents exposure to the OOH. This shows that the audience could either already be on their way to the location, or they can go there because of seeing an OOH advertisement. This model shows that visitation and treatment cannot cause the audience attributes. It requires that there is no situation that can cause both treatment and visitation, rather treatment is caused by the audience being exposed and that causes location visitation, or the audience is already planning to visit the POI. We built a generative model based on this graph that produces synthetic data sets that mirror the real-world distribution complete with devices, exposures, and visits. This allows us to have a known truth set for every device interaction.
We have three attribution approaches to correctly account for spatial correlations:
We match demographics, history and spatial history with a user's propensity to visit a POI.
We match that similar demographic, history and spatial history to a user's propensity to see an OOH creative for the campaign.
We use control units or control units that match the distribution of the audience and visitation propensity. Once these audiences are established devices can be randomly paired based on their time of first exposure.
This sets it up so that in our model the pre-treated control group and the untreated control group should show on a graph with similar results centered at zero with a small amount of variance.
How Control Groups can be Manipulated for Higher Campaign Results
One of the reasons why we are so careful and methodical in how we determine control devices and units is that it would be very easy to skew the results to show a higher visitation lift than what actually occurred.
If control units are chosen that match the audience demographics but the devices pinging them have little or no likelihood of visitation to a POI, then they are not good control units as they would not accurately compare to the pretreated campaign units. This is why they must be chosen based on similar visitation rates to the store.
Also, if the chosen control devices do not provide location data as frequently as the treated devices, then results can be skewed because potential visits that would remove a device from the control group could be missed.
If spatial correlation and observability are not properly accounted for, it can make an OOH campaign look like it was much more effective on visitation lift than it actually was.
Conclusion and Next Steps
Using well-established causal models adjusted to account for spatial correlation can help to measure the lift caused by viewing OOH advertising more accurately. We illustrated several ways that this feature of OOH can be misused or ignored to create misleading results that harm trust in the power of OOH advertising. At Billups, we are continuing to advance this form of measurement in terms of accuracy and in enhancing the privacy of devices in the dataset. Want to learn more about how we work to validate the results of your OOH campaigns? Contact us today!
Our news


