Analyze and Optimize Your Out-of-Home Performance
Dive deeper into your campaign performance, discover essential insights, and boost your results with our qualitative analytics provided by the Billups Analytics™ dashboards and advanced studies.
Pre-planning solutions
Overlay data insights to identify which pieces of inventory are most likely to be viewed by an audience in a period of time, or leverage Billups attention-mapping technology against creative versions to predict if the user drives attention toward optimal areas of the creative.
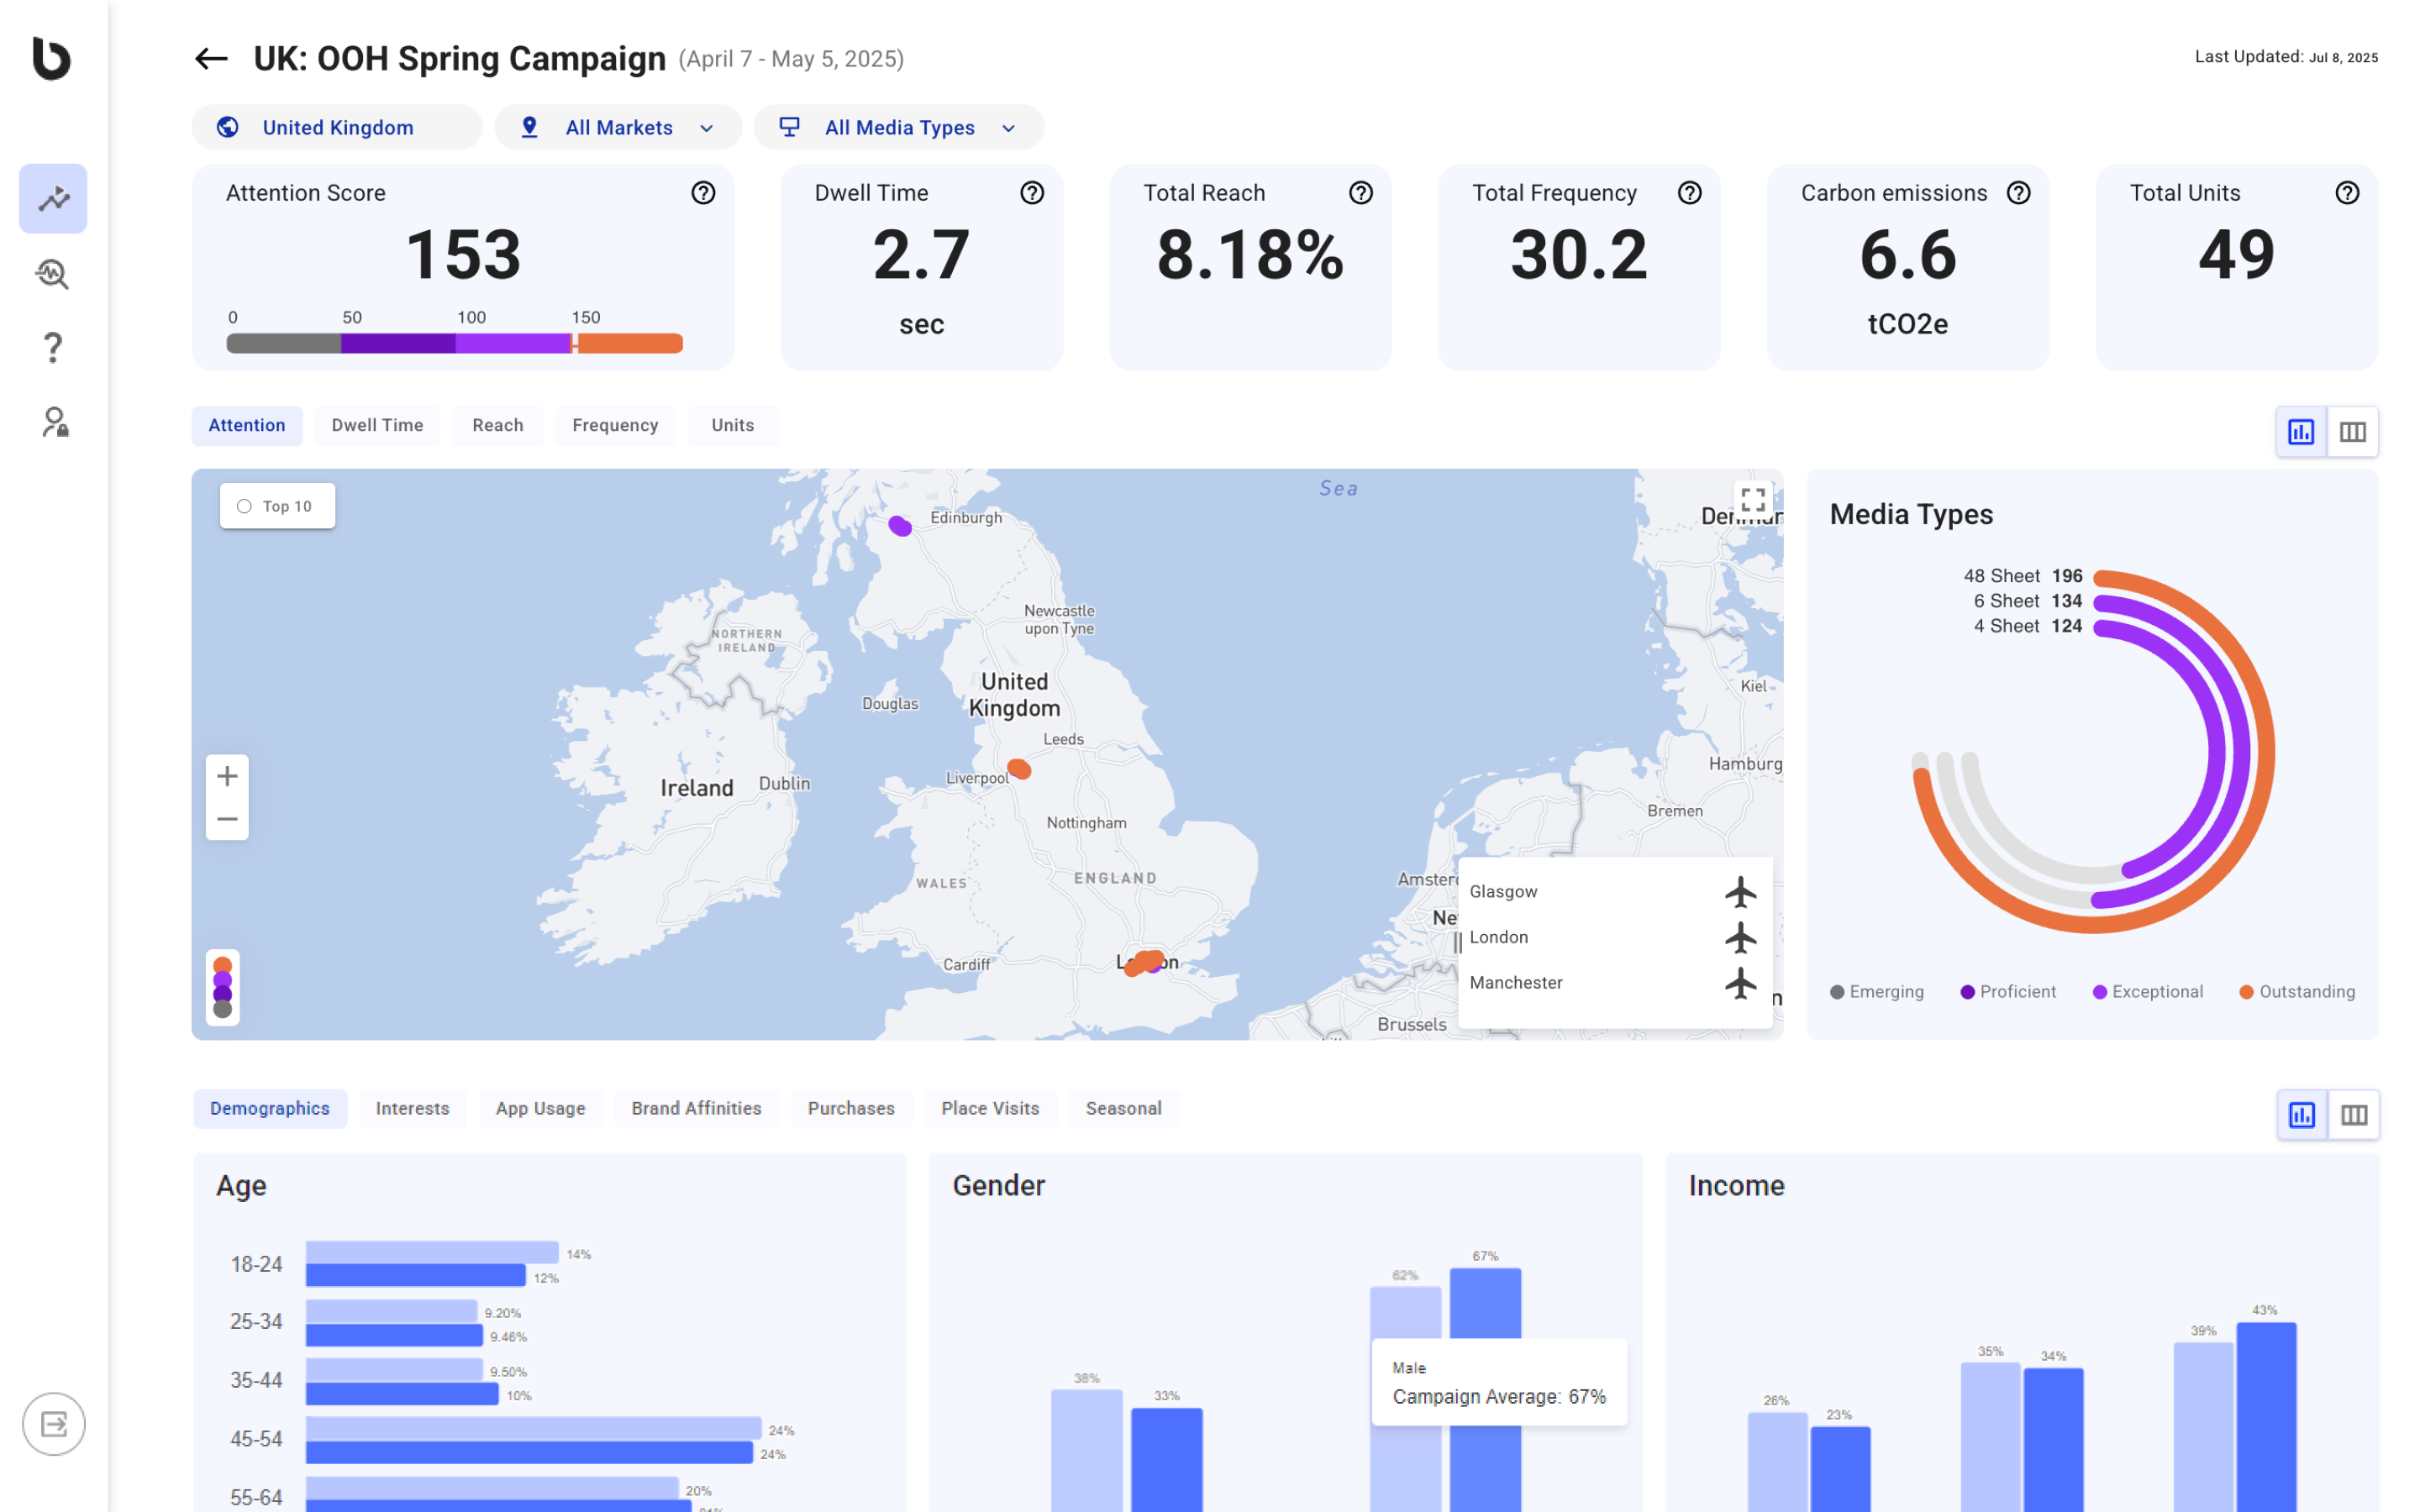
Dashboard visualizations
Summarize and contextualize campaign delivery in a single market or multiple markets to keep OOH accessible and accountable. Assess which boards had garnered higher volumes of attention over other billboards. Insights on Reach, Frequency, dwell time, and audience demographics included.
Attributtion studies
Measure the effectiveness of Out-of-Home campaigns based on brand KPIs. Partner with Billups to leverage mobile location data to determine incremental foot traffic lift, use brand surveys to lift in brand metrics over OOH campaign flights, or establish an appropriate data feed to match OOH exposures to web or app-based outcomes.
Audience exposure dashboard
Summarizing campaign exposure with market-specific results for easy comparison. Insights on reach, frequency, and audience demographics included.
Web impact / App download report
Measuring the impact that OOH had on web traffic, web / app visitation, online sales on a brand website / app, or app downloads.
Customized measurement
Leverage Billups patented solutions to solve advanced OOH measurement challenges, such as fleet measurement or creative analysis.
Placement Strategy
Utilize Audience Heatmaps to visualize global audience densities and Inventory Indexing to identify the most visible OOH units for your target audience.
Creative Insights
Harness Creative Attention Mapping for insights into human attention on your creatives, with our technology providing comprehensive photo and video analysis.
For too long, the Out-of-Home industry has grappled with the lack of rapid, accurate, and dependable measurement of results. Billups Analytics ™ Audience Exposure Dashboard solves this challenge by providing reports from campaigns in near-real time, ensuring the investment is worthwhile.
LEARN MORE
See how your campaign is performing day by day in almost real-time
Learn which units perform best for your campaign
Segment campaigns to understand performance by market and unit
View average frequency by time or media type
Calculate market reach over time
Analyze audience by age, occupation, income, relationship status, education and housing type
Billups Analytics™ Brand Study Dashboard seamlessly blends advanced analytics with intuitive visualizations. It's your gateway to data-driven decision-making and strategic brand optimizations, keeping you one step ahead in the competitive landscape. Elevate your Out-of-Home (OOH) campaigns through continuous improvement, ensuring maximum impact and effectiveness.
LEARN MOREAd Recall: Enhance recall for lasting impressions.
Ad Likability: Craft campaigns that resonate positively.
Market Awareness: Strategically broaden your reach.
Brand Awareness: Strengthen your brand presence.
Brand Perception: Shape positive perceptions.
Brand Consideration: Drive consumer consideration.
Net Promoter Score (NPS): Cultivate brand advocates.
WORK WITH US
Our data scientists, media experts & industry professionals are here to help
Leverage Billups patented solutions to solve advanced OOH measurement challenges, such as fleet measurement or creative analysis.
To identify the visitation and conversion changes from the exposure event we intersect the exposed devices with devices that have visited the website and apply a method to see the differences between visitation behavior before and after the campaign.
To measure the impact that the campaign had on app visitation, online sales, or app downloads, we cross-reference devices that were exposed with those that have taken action.
Compare the footfall lift to the POIs (points of interest) related to your OOH campaign. Identify the audience that was brought by your ad by assessing their exposure and matching the exposed audience with those who visited the noted venue.
Discover the impact of OOH campaigns on sales with our Sales Lift study. Run campaigns strategically near stores to gain a concise, side-by-side comparison of overall and incremental sales between stores targeted by the ads and those not targeted.
The Exposure Delivery study unlocks precise insights into top-performing markets and OOH units. Go beyond estimates, accessing real user exposures based on mobile data for unmatched accuracy.
Find accountable campaign insights
The dashboard provides valuable insights that will help you better understand the market and uncover expansion opportunities. Dive into the results, find top-performing markets and units, and unearth potential growth opportunities for developing your media plan.
Let's keep talking
If you are interested or want to learn more, fill out our contact form, and a team member will be in touch within 48 hours.