Airport Dashboard: A smarter way to measure Airport OOH
Airport environments are unlike any other channel in Out-of-Home.
Passengers move through terminals differently depending on where they’re traveling, how much time they have, and where they are in their journey. Some rush through security. Others spend hours near gates, lounges, or baggage claim areas. Attention shifts constantly throughout the airport experience.
Traditional airport reporting has struggled to capture that complexity.
Most measurements have historically relied on passenger counts, estimated impressions, or inventory reporting. While useful, these approaches don’t fully explain:
- Who it actually reached
- How audiences moved through the airport
- How long have they engaged with media
- Which placements performed best
The billups Airport Dashboard was built to change that.
As part of the billups Analytics™ suite, the Airport Dashboard combines mobility intelligence, airport passenger data, and campaign measurement into a unified platform designed specifically for airport OOH environments.
Here’s a closer look at how it works.
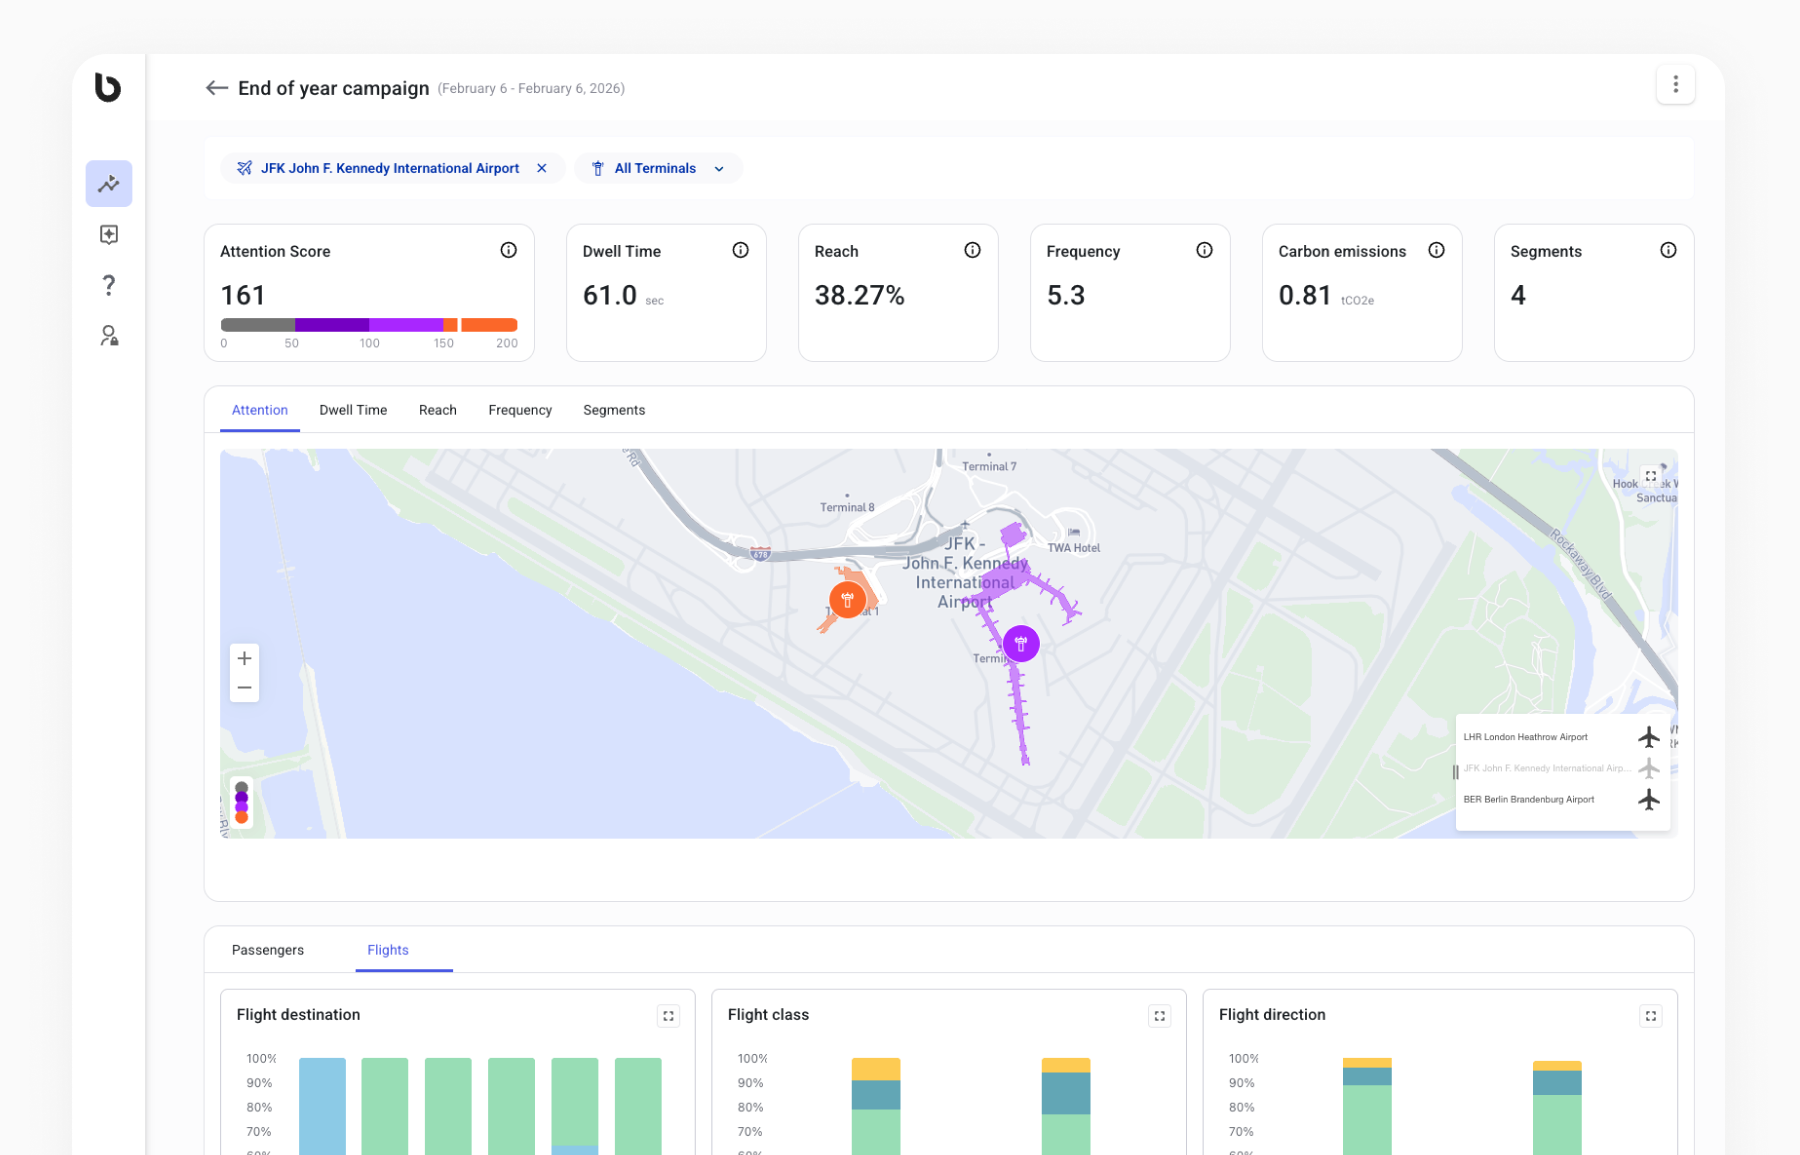
Understanding Passenger Movement
The foundation of the Airport Dashboard starts with understanding how people move through airports. While passenger counts tell you who passed through. The Airport Dashboard tells you who actually saw your brand — and for how long.
Using anonymized mobile location data, the platform identifies when a passenger visits an airport and maps their movement throughout different airport sections. Location signals are grouped into visits, allowing the system to calculate:
- Where passengers spent time
- How long they stayed
- Which areas they moved through during their journey
This creates a detailed view of passenger flow across the airport environment.
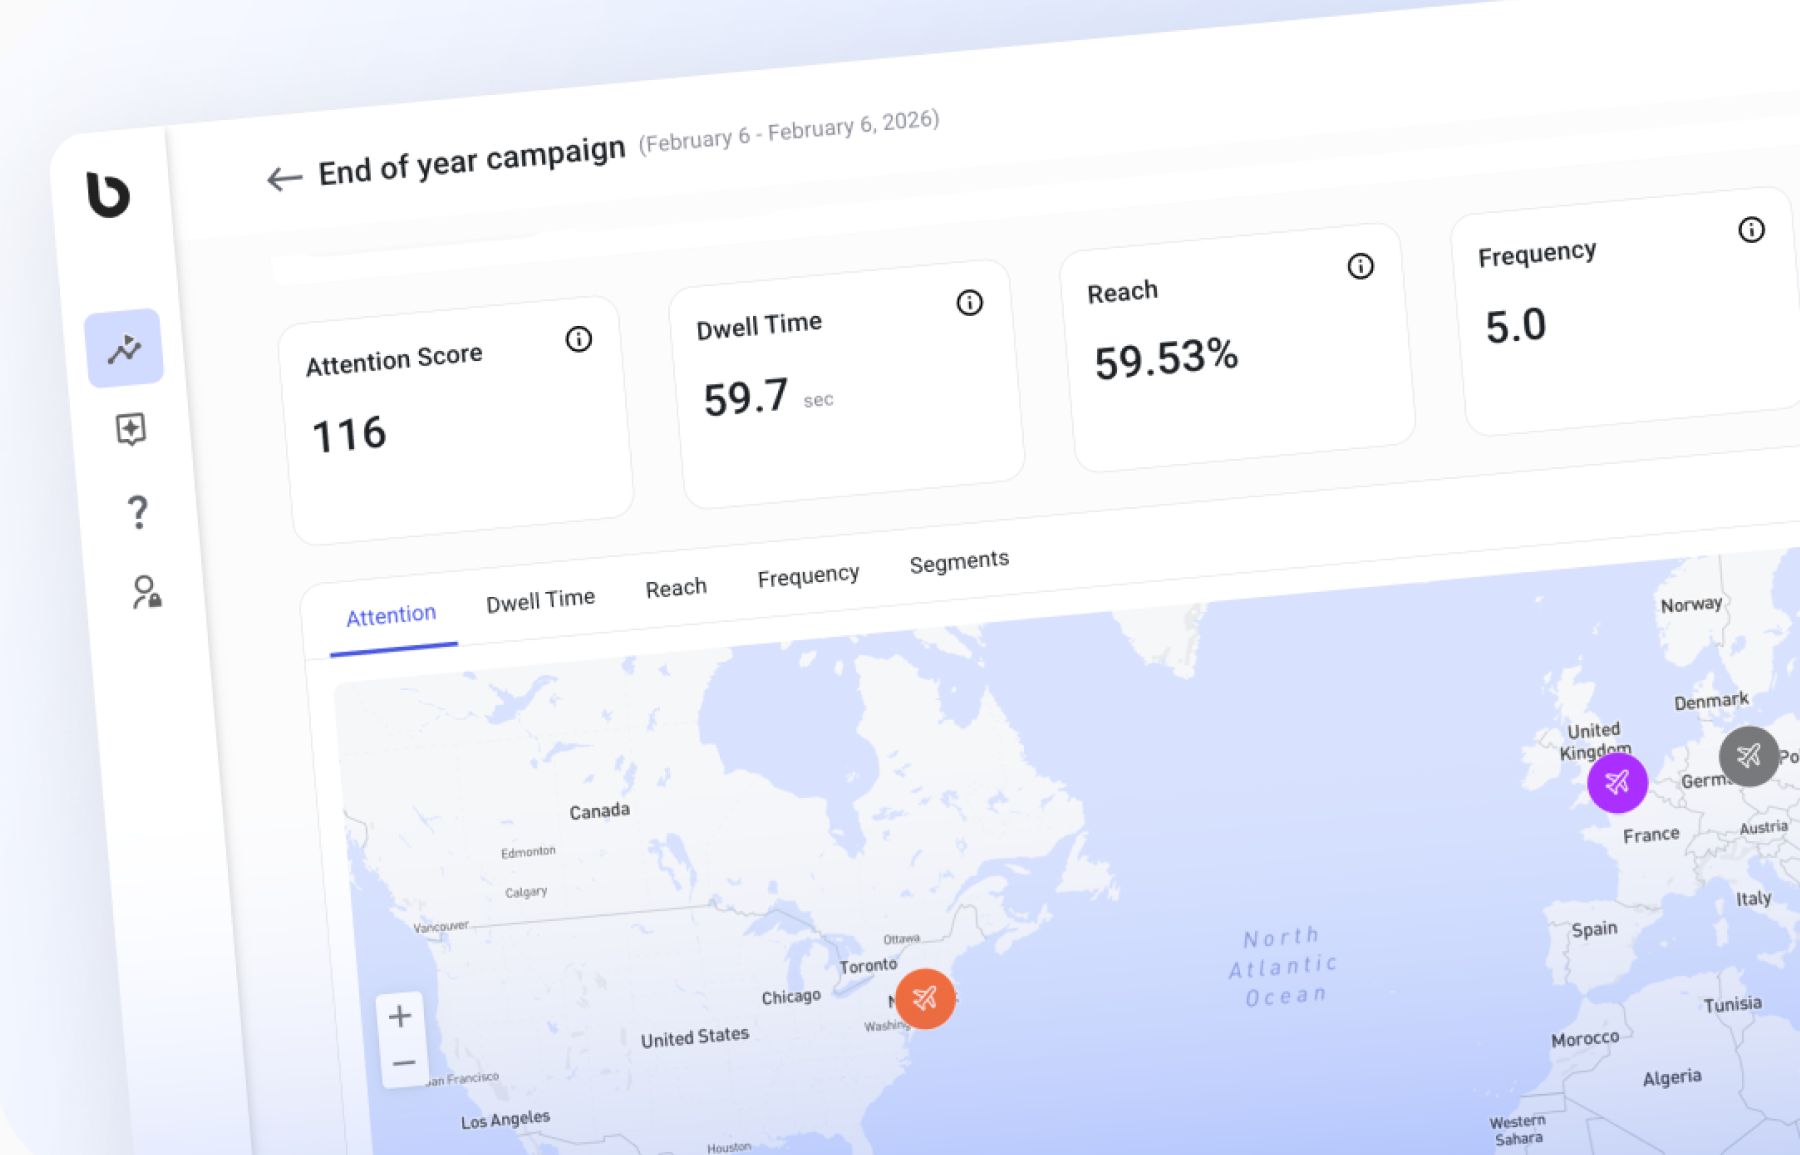
Understanding Exposure Across the Passenger Journey
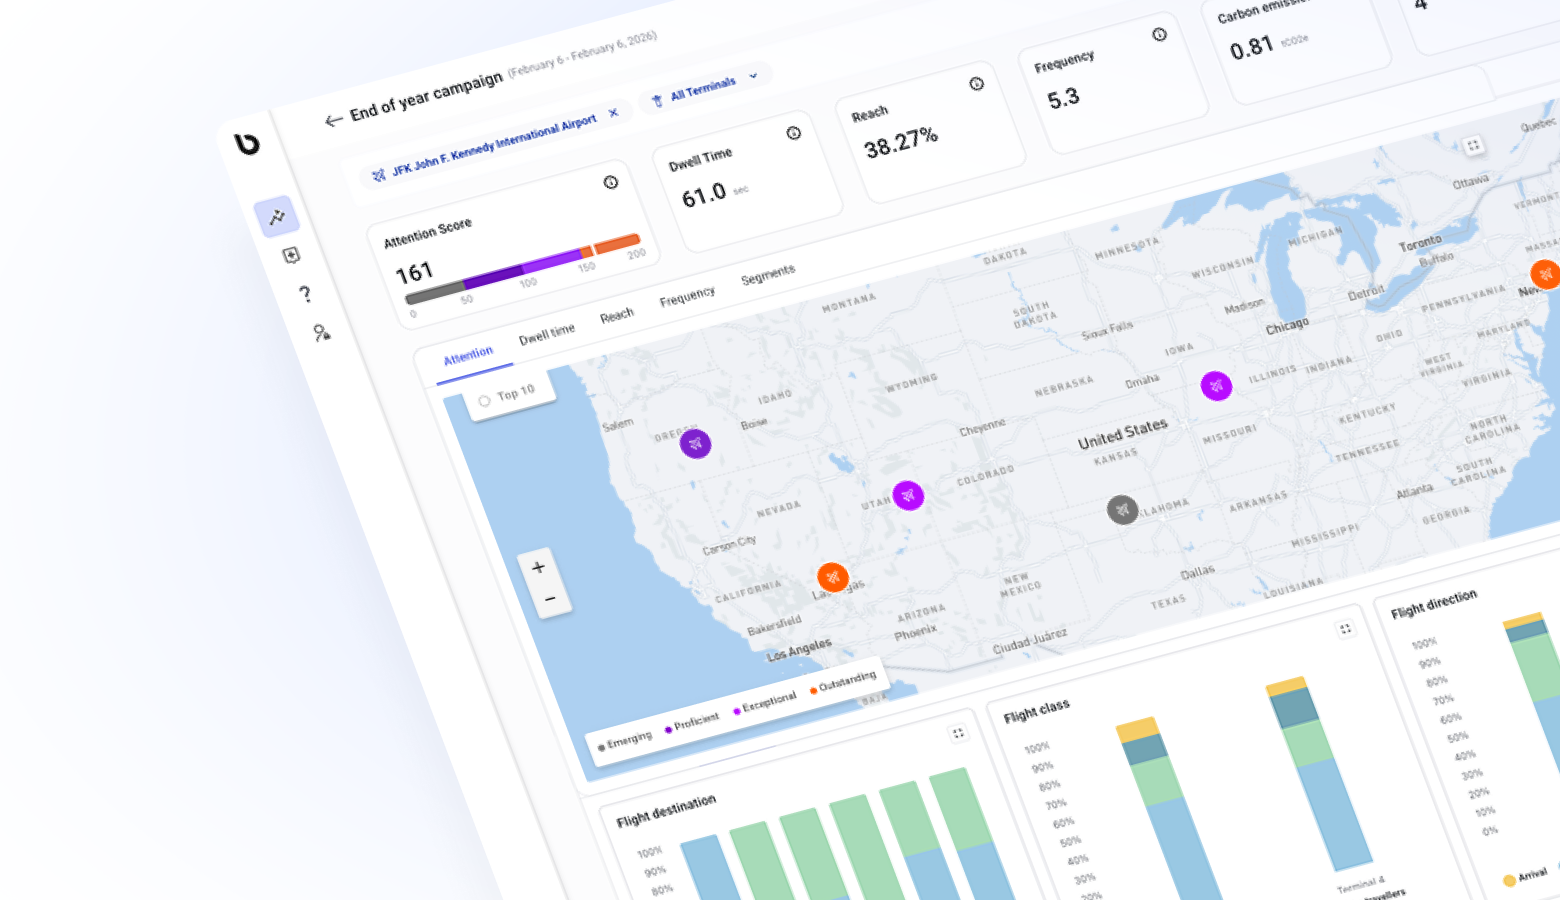
The Airport Dashboard measures campaign exposure by identifying when passengers are present in areas containing campaign media. Rather than treating all airport traffic equally, the platform uses probability modeling to estimate which passengers were likely exposed to campaign units, how often they encountered media, and the quality of that exposure. Reach is then scaled against broader airport passenger volumes to estimate the total number of unique travelers reached throughout the campaign.
Because airport journeys vary significantly—from quick terminal visits to long layovers and delays—the dashboard also measures average dwell time, frequency of exposure, and repeated encounters across terminals and airport zones, providing a more realistic understanding of how airport media performs throughout the full passenger journey.
Introducing Attention Score
Not all airport placements generate the same level of visibility or engagement.
The Airport Dashboard includes an Attention Score designed to evaluate the relative attention potential of each placement based on factors such as:
- Unit size
- Placement location
- Passenger dwell patterns
- Nearby media competition
High-value environments like gate seating areas, arrivals, and baggage claim zones often generate stronger attention opportunities due to longer passenger dwell times and more focused environments.
This allows advertisers to compare inventory quality across airports and terminals using a consistent framework.
From Reporting to Optimization
The Airport Dashboard is designed to support more than post-campaign reporting.
“Measurement should help advertisers make smarter decisions, not just review past performance,” said Dmitry Semenov, Global Head of Product at billups. “The ability to compare environments, understand audience movement, and identify stronger-performing inventory creates far more actionable airport media planning.”
Advertisers can use the platform to:
- Compare airport performance
- Evaluate terminal-level effectiveness
- Identify high-performing inventory
- Optimize future media investment
- Improve campaign planning strategies
This shifts airport OOH measurement from static reporting toward ongoing optimization and decision-making.
A New Standard for Airport OOH Measurement
Airport audiences have always delivered premium value. What advertisers have historically lacked is a clearer understanding of how passengers actually move, dwell, and engage throughout the airport journey.
By combining mobility intelligence, dwell analysis, audience insights, and campaign measurement, the billups Airport Dashboard offers a more transparent and actionable approach to airport OOH measurement.
The result is a smarter understanding of campaign performance across one of the most dynamic media environments in the world.
To learn more about the platform, visit billups Airport Dashboard or request a demo to explore how airport OOH measurement can move beyond impressions toward real audience intelligence.