
Knowing whether or not your Out-of-Home (OOH) was viewed is integral to understanding how your campaign performed. At Billups, we have three computer vision patents that help us understand whether an OOH unit is in view, whether any objects are blocking the unit, and the unit's orientation. This information helps us establish a viewshed of the vantage points from where the OOH unit can optimally be seen. With mobile location trace data, we can determine how many devices and, likely, eyes were exposed to the unit during its campaign flight.
In this article, you will learn why object location is important, how our technology works, and how you can leverage this information to build better campaigns.

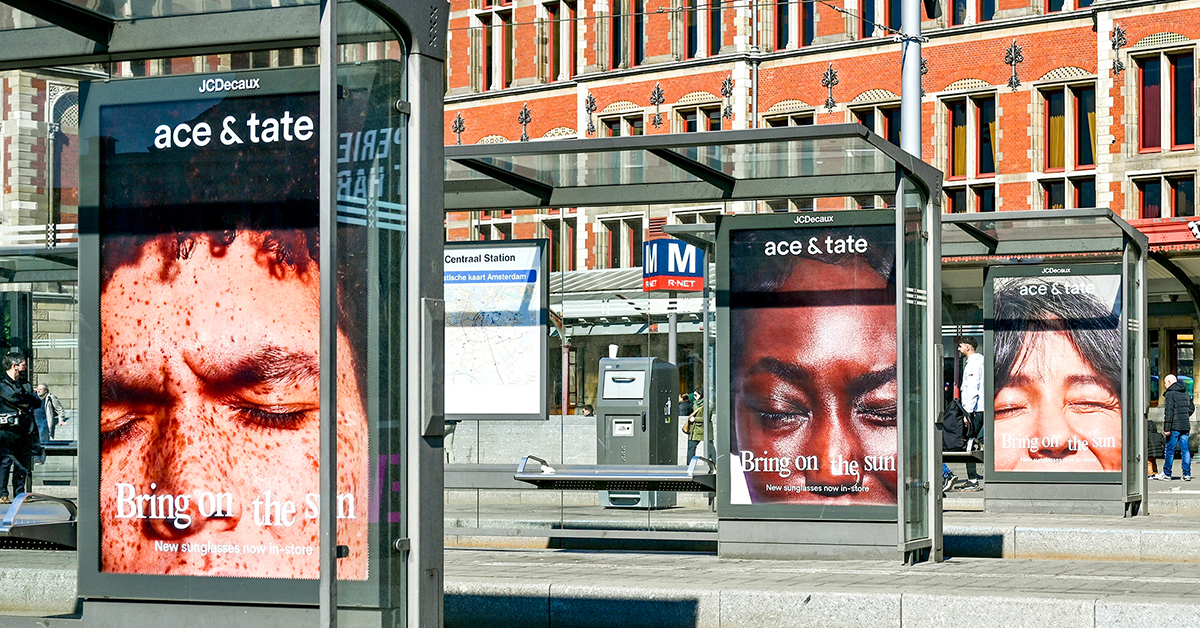
Many OOH companies will build a viewshed based on a person’s proximity to an OOH unit and determine their Opportunity to See (OTS) simply based on that.
Billups’ patented technology furthers this, factoring in the person’s relationship to the board or Opportunity to View (OTV). Our first computer vision patents are our SSI patents. The patent was named after Shawn Spooner, Billups CTO, and Sicong Chen, Billups Senior Staff Scientist. SSI helps us understand the OOH. Our system can use information from Google Street Level images and other third-party data to determine the format and the surrounding scenery.
By layering images taken about 5 meters apart, our machine-learning models can create three-dimensional images from two-dimensional pictures. Our SSI patent then labels everything in the image to the pixel level.
As you approach the Billboard, taking an image every few seconds, you can get an idea of obstructions. Where are they? What are they? Are there trees? Are they deciduous or coniferous? How visible is the unit? From this object location data, we can determine an accurate viewshed that closely resembles how someone may see an OOH ad.
Knowing object location - of the unit itself, its orientation, and anything else that may be drawing attention away from the OOH or blocking its view- is crucial for evaluating marketing touchpoints.
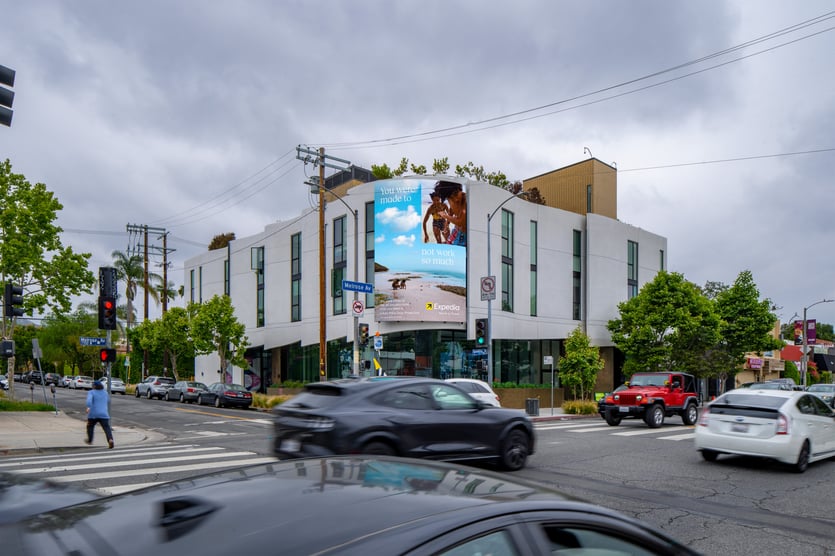
Once we have determined the viewshed for an OOH unit and how likely it will be noticed in a scene, we can score that unit against its surrounding environment. Using mobile device data, we can see how many devices have traveled through that viewshed. We calculate the probability of viewing the unit, and how much attention would be paid to the unit to determine whether or not a user was likely exposed to the advertising based on the aforementioned factors.
Mobile devices send out location traces at different times and rates. Most traces will be sent from places people frequent. Most people have two to three places they frequent: work, home, and a third place. By reviewing a user’s history of mobile traces and where they send the most signals from, you can determine the primary areas they tend to go to. Knowing where they tend to go and traces along the paths connecting those locations, you can get a pretty good idea of the route they likely took to get there. We use this location data to reconstruct their probable journeys and any OOH they may have encountered, whether or not their journey has passed through the viewshed itself.
Audience exposures predict how many users had an optimal opportunity to view an OOH campaign or the Opportunity to Experience (OTE) that campaign. Given the location of an OOH unit and an individual device’s daily journey, we can judge the likelihood of an exposure to the unit. This likelihood measures the success rate of the specific advertisement capturing that person’s attention. We score exposures based on the mobile device data and factor in criteria based on the human visual processing system, including the speed users are traveling, the direction, elevation, and any competition for attention.
Audience exposures apply machine learning algorithms to make precise, accurate, and stable predictions of audience view counts. Knowing who was exposed to your campaign can help empower and contextualize your OOH campaigns.
Our patented object location and scoring technology validate who was or was not exposed to OOH. Billups Analytics™ puts the power in the advertiser's hands so that they can know how many people were exposed to their OOH units. Data breakdowns include delivery by unit, audience demographics, and campaign reach and frequency metrics. Using Billups Analytics, you can track campaign performance in near real-time and adjust your campaign for optimal performance. Contact us to learn more today!


