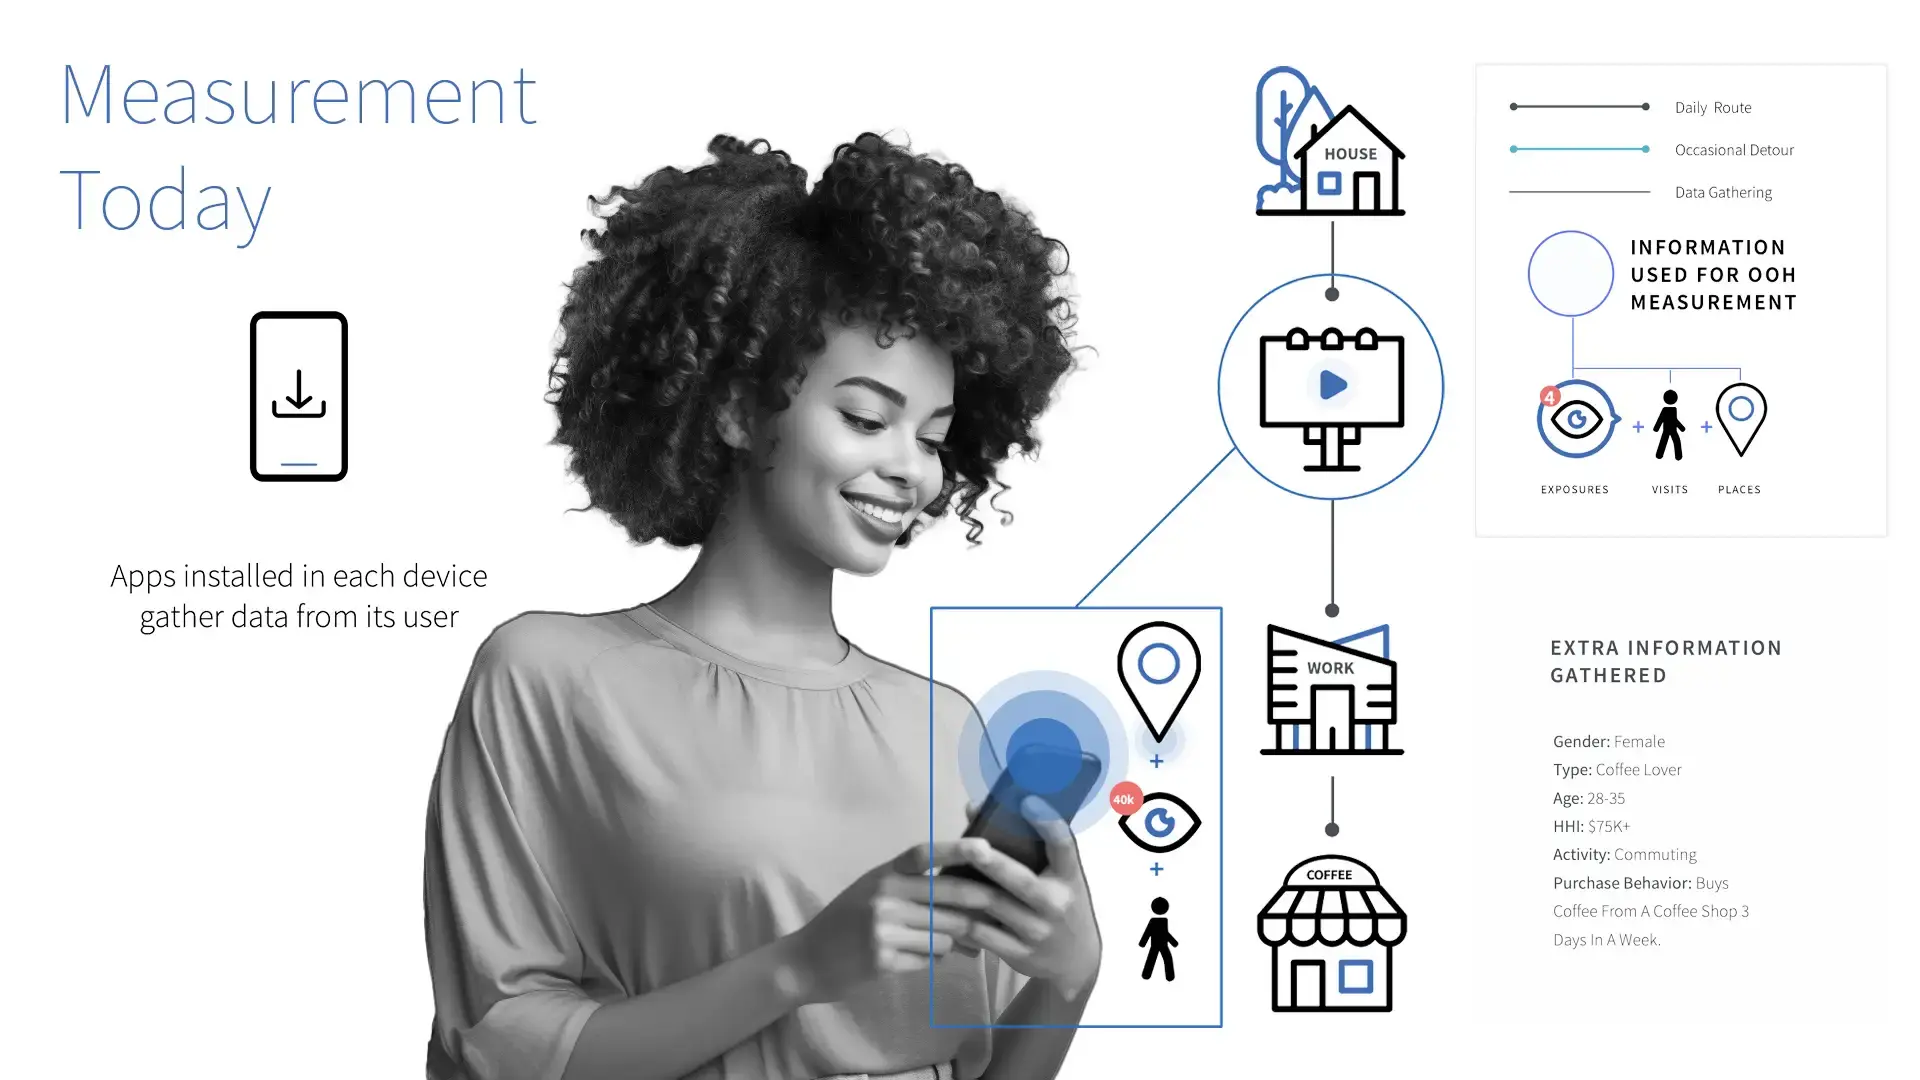
At Billups, much of our Out-of-Home (OOH) campaign attribution is based on mobile data. While mobile data can provide location insight, it tends to be spotty and noisy. A device might give off location traces every second for five seconds and then be gone for five minutes. This leaves significant gaps in a person's movements, showing them in one location and then at another, with little indication of what path they may have taken to get there. What happens between those dots? How do we connect the dots to show an entire consumer journey and assess whether they likely saw an OOH ad?
Billups has pioneered OOH measurement to answer these questions and developed several patents, including Machine-based Prediction of Visitation Caused by Viewing, Verification Systems for Message Delivery and Processing, and the Opportunity to View an Object in Image Processing. Equipped with these technologies, we can map out consumer journeys and determine whether they were exposed to an OOH unit and whether exposure to an OOH advertisement along their path has influenced their likelihood of visiting a business.
Understanding Consumer Behaviors in OOH
Many OOH ad tech companies that do measurements are likely undercounting the number of OOH units viewed. They will only count an exposure if the mobile trace falls into the geofenced area of a unit, but it's likely that if other units were along that journey, they could have seen those as well. Several actions could be taken that are somewhat questionable, such as using small, hand-selected samples that make a campaign look like it performed much better than it did without considering all of the other factors involved or using questionable datasets that are not from the campaign flight dates or are fictionalized entirely.
How do you solve these problems to create a more accurate picture of what a person likely did? A person's travel history can shed light on this.
Most everyone has places they go to regularly. Pre-Covid, this would be work, home, and a third place. The third place is often a hobby or place where they relax and unwind from their daily lives. Though many people now work from home, there are still places that they will go to regularly.
A model can learn where they are likely to go in the future by looking at a person's history of where they go regularly. In general, people have predictable patterns. They may change from day to day but have stable core elements. Past behavior is predictive of future behavior on short time scales.
If you think about a person's day and randomly sample 20 points over time a day over a week, you'll find that person's home, work, and the third place they frequent. These three key data points describe a person and can tell how the person might get to those places. The routes may differ based on the day and traffic conditions, but there likely are a few variations. Mobile location traces will show when someone is in their home, then on a highway, then at work. Even if the rest of the trip is not captured through mobile data, a person showing these traces is probably on their way to work. Even if the OOH unit was not seen in the data, if it is along that path, it is highly likely that the unit was viewed.
Using Trip Interpolation to Determine OOH Exposures
The second part that helps figure out OOH exposures from mobile data is the journey of fellow commuters. When driving down a road or highway, other people are traveling along the same road. You share parts of your journey with them. There will be inflection points where your journeys will sync up. If you look at the data and see that two devices were in proximity at points A and C, they are most certainly also together in B, even if no mobile data shows them together.
But when we use this data, we are not comparing 1:1. We are pairing dozens, hundreds, or even thousands of devices together and comparing the anonymized data. If you can see that two people were at A and Z, but there are no traces of them together in the middle, then a third person who also has A and Z with some traces of the middle can be added. Using inferential logic, you can get the timing for everyone involved in that journey. This correlation and the interpolation of trips get more robust and accurate when more devices are added to the model. This gives us a cohesive picture of the audience traveling together on that road.
Once the consumer's probable journey is established, we can derive that a person started from a particular region, turned at a specific junction, got stuck in traffic, and arrived at their destination. We can also see the OOH inventories that they could have been exposed to along the way.
The motivation for us creating patented technology around this was to give a more accurate count and a better estimate of who was exposed and who wasn't. We use this same data with a control group not exposed to the measured OOH units, and the results become even more accurate. Knowing who was probably exposed and who probably wasn't gives you a truer read of what's happening in the market, rather than just showing what is in the hard data set at that viewpoint and exposed. It creates a broader net of the people who most likely saw it and visited an in-store location and those who unlikely saw it and still visited. It allows us to work with larger samples of the market. It gives you a clearer picture of the market and a greater chance of accurately measuring what's happening because of OOH.

How Can We Predict Customer Journeys in OOH?
We have systems that can turn raw mobile data into a fully-fledged customer journey through trip interpolation. This involves a couple of our patents, which makes our process unique.
From a data science perspective, if several mobile device signals exist at different locations, what is the most logical and cohesive route that can be drawn through those signals? The issue is that the signals are not consistent. Different devices will ping at different rates and times. The noise goes up consistently over time. This requires other methods to be involved and assumptions to be made to know what these devices likely did.
We take the mobile data to map the customer journey using our patent technologies described above. We can map devices to the road network to help us understand how people move through a market. We can use mobile data to see that someone is on a particular road and has a certain percentage chance of visiting a particular location because they have done it in the past. If they have been to that location before, they are more likely to visit it again.
What we are doing here is path interpolation and completion. Many candidate routes exist for an individual. When we incorporate the time between measured points and the speed limit on these routes into our calculations, the possible pathways are narrowed down. This is how we differentiate a highway route from a train ride. This can also work for pedestrian pathways. The dwell time for pedestrians exposed to an OOH ad is often higher than that for drivers. In addition to completing consumer journeys from sparse data points, we have technology such as our viewshed patent to inform the vantage points from where an OOH unit is most likely to be seen along the journey and how the viewability is indexed against the surroundings.
Our technology even factors in traffic jams. By looking at the surrounding vehicles, they will have similar location traces and time stamps. In the patent, this is referred to as co-referencing. A mobile device may send signals multiple times from similar locations. The longer you spend in a place, the more likely you are to send a trace that you were there. When someone is in a fixed location such as home or work, they will send more signals from those locations than from locations where they are en route to a place.
Our patents work together to help us know someone's past patterns and identify factors that would lead someone to visit a location without the effect of outdoor advertising. It's about understanding the fundamentals for it to be measurable. Using coffee shop patrons as an example, here are some of the questions we are trying to answer in our measurement and attribution studies:
- Does someone on a road segment make them more likely to visit a coffee shop regardless of whether they have visited before?
- How likely is a person to go to the coffee shop based on their location and history?
- If we can piece together the first portions of a person's journey, what other elements do we need to consider to know whether the patrons likely visited due to OOH or if they would visit anyway?
- What is the repeat visitor effect?
- How many new visitors were there? What was the effect on those who had visited the shop in the past? Do they go more often now?
When we look at the effect on incremental visits and quantify the effect from confounding factors, and we know they passed by an OOH ad for that coffee shop, we know the OOH probably caused the visit.
But to gain a clearer picture of audience market behaviors, you also have to use a control group of those who were definitely not exposed to the OOH and look at how often they would visit this location. The control group is matched to the tested group. It's essential to see if there was a difference between the groups who saw the ad and those who didn't and how that affected their likelihood of visiting the store.
We don't need every device in the market to have location-sharing data to gain this information. When you go to the doctor for a blood test, they don't draw all your blood, just a tiny sample. The same is true for testing a market. Just like the doctor only needs some of your blood to gain important insights about how your body is functioning, we don't need to sample every device in the market to get a good idea of the market as a whole and how the OOH is performing. We can get a good measure of potential outcomes from a good representative sample.
Work with Billups to Gain Insights into Your Customer Journeys
Want to learn more about trip intent prediction and how to plan an effective OOH campaign? Find out who was exposed to your OOH campaign, how many were exposed, and whether there was a lift in store visitation due to your advertising efforts. Reach out to Billups today.